Changes in P/E Ratios in the Nifty IT Index Over the Last Decade
Introduction: Nifty IT Index—Structure, Purpose, and Constitution
The Nifty IT Index is a sector-specific benchmark on the National Stock Exchange (NSE) that tracks the performance of India’s leading IT companies. Its primary purpose is to serve as a barometer for the Indian information technology sector, helping investors and analysts gauge industry health and make informed strategic decisions. The index includes companies engaged in IT infrastructure, education, and software services.
As Ecosystem Ventures, though our focus has largely been on smaller IT companies (typically <1000 Cr.), we do actively track the larger companies to learn from emerging trends.
How Is the Index Calculated and Maintained?
- The Nifty IT Index is calculated based on the free-float market capitalization method. This ensures only shares available for trading are considered, making the index a realistic representation of market sentiment.
- The index is reviewed and rebalanced semi-annually, using data from the prior six months to reflect shifts in liquidity, trading frequency, and sector relevance. Eligible companies must exhibit high turnover, consistent trading activity, and a sustained listing history to be considered.
- Corporate actions (like stock splits and mergers) are handled via divisor adjustments, ensuring that the index value remains comparable over time.
- A professional team manages the index, overseen by a three-tier governance structure to ensure integrity and transparency.
Current Constituent Companies (2025):
The index comprises 10 companies, typically the biggest and most liquid IT stocks in India. As of August 2025, the constituents are Tata Consultancy Services (TCS), Infosys, HCL Technologies, Wipro, LTIMindtree, Tech Mahindra, Persistent Systems, Oracle Financial Services Software (OFSS), Coforge, Mphasis
Each company’s weight in the index is based on its free-float market cap, with TCS, Infosys, and HCL Tech collectively dominating the index, reflecting their influence on the industry.
Overview: Why Track the Price-Earnings Ratio (P/E)?
The price-earnings (P/E) ratio is a key valuation metric that expresses what investors are willing to pay per rupee of earnings. In sector indices like Nifty IT, the index-level P/E offers insights into:
- The market’s growth expectations for the IT sector.
- Relative valuations versus historical averages and other sectors.
- Investor sentiment around current and future profitability.
A high P/E typically signals strong earnings growth forecasts and optimism, but can also mean the sector is overheated. Conversely, a low P/E may reflect subdued sentiment or undervaluation due to cyclical downturns.
How Have P/E Ratios of Nifty IT Changed Over the Last Decade?
Historical Trend (2015–2025):
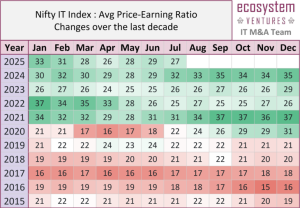
Here’s a heat-map our team created while analyzing how the PE ratio has changed over the last decade.
Key Observations:
- 2015–2019: The sector traded in a stable P/E range (~17–22), reflecting steady but unspectacular growth as Indian IT matured and global outsourcing demand stabilized.
- 2020–2022: The sector saw a dramatic surge in P/E, peaking above 35. This can be attributed to the global pivot to digital transformation during the pandemic, as companies rushed to digitize operations, boosting order books and profit outlooks for Indian IT companies. This was also perhaps driven by low interest-rates and sudden surge in liquidity
- 2023–2025: With the end of pandemic tailwinds and normalizing demand, P/E ratios have moderated to 25–33, reflecting both sustained optimism and some recalibration of growth expectations. It is also notable that there’s a visible decline in PE ratio after the new government in the US.
What Does This Shift in P/E Ratios Indicate?
1. Changing Growth Narrative
The jump in P/E during 2020–22 indicates investors anticipated a step-change in sector profitability. IT companies secured multi-year transformation deals, saw improved pricing power, and benefited from cost optimization. This gold rush, however, also resulted in premium valuations that eventually normalized as growth rates stabilized.
2. Investor Sentiment & Risk Appetite
High sector P/Es signaled robust investor appetite for tech exposure and willingness to pay up for perceived certainty and secular growth. As interest rates and macro risks have evolved (especially in the US and Europe where clients are concentrated), investor focus has shifted more toward sustainable, profitable growth and resilience.
3. Cyclicality and Resilience
The moderation of P/E ratios post-2022 demonstrates typical market behavior: early exuberance for structural winners gives way to more nuanced views as economic cycles reassert and earnings volatility returns. Yet, even at 2025 levels, the P/E remains relatively high, reflecting the enduring strategic importance of Indian IT to global business.
4. Long-Term Outlook
- The premium assigned to the sector is likely sustainable as long as Indian IT companies continue to win large deals, expand digital and cloud offerings, and deliver on operational efficiency.
- Any sharp drop in P/E (without an earnings collapse) could signal either a buying opportunity or, conversely, a warning of deeper cyclical headwinds.
Investment and Business Strategy Perspective
For investors and business strategists:
- Watch P/E Relative to Earnings Growth: The sector’s ability to maintain premium multiples relies on demonstrating both topline (revenue) and bottomline (earnings) growth. Any missed expectations can lead to swift corrections, as seen in the post-pandemic normalization.
- Diversification Within IT: While TCS and Infosys lead, companies like Persistent Systems and Coforge are nimbler and focus on cutting-edge, high-growth niches (AI, automation, etc.), which may command even higher P/Es during tech upcycles.
- Macro Sensitivity: With the majority of revenue from US and Europe, the sector is sensitive to currency moves, recessions, and tech budgets abroad—key risks that affect future multiples.
Conclusion
The past decade’s data paints a picture of a sector that’s oscillated between stable growth, exuberant optimism, and rational recalibration—mirroring global digital trends and investor sentiment. As the tech landscape continues to evolve, so too will investor expectations and sectoral P/E ratios.
For smaller tech companies – whether listed, or those looking to list at some point in their journey, it’s critical to have a deep understanding of how the wider / more mature market is evolving, and investor appetite and perception of the overall industry.
Comments are closed.